The Learner Engagement Dashboard contains visualizations for engagement metrics, such as course activity, assignment status, and course history, for an individual learner across all their courses.
Note: Your Engagement Dashboard and Learner Engagement Dashboard share the same settings. You have access to users on the Learner Engagement Dashboards whose role is included in the Role filter setting on the Engagement Dashboard.
Accessing the Learner Engagement Dashboard
From your Engagement Dashboard:
- Locate the Results table.
- Click the name of the learner you wish to investigate.
From the Insights Portal:
- Click the Learner Engagement card.
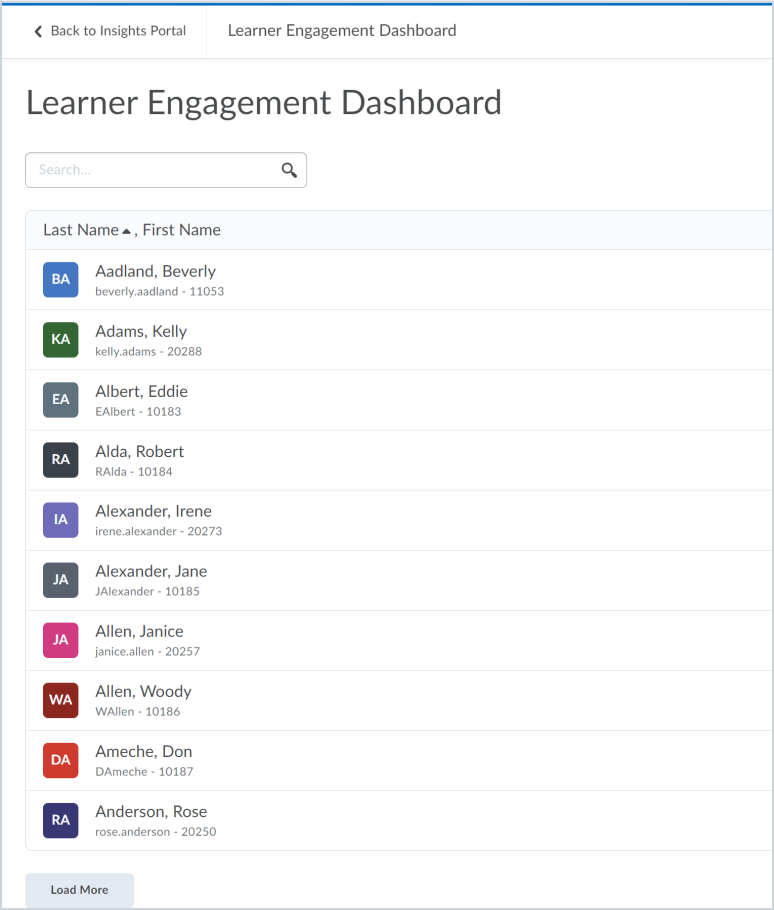
- In the Learner Selection view, locate the name of the learner in the list or type it in the Search box.
- Click the name of the learner you wish to investigate.
Viewing and Interacting with the Learner Engagement Dashboard
This dashboard contains 3 main sections, similar to what appears on the Engagement Dashboard:
- Filters for Org Unit and Semester. If you click on a data point in a chart in the Summary View to further filter report content, those filters are also listed in this area.
- The Summary View section includes the Courses in View summary, Average Grade summary, Overdue Assignments summary, System Access summary, Grades Over Time trend chart, Content View Over Time trend chart, and Course Access Over Time trend chart.
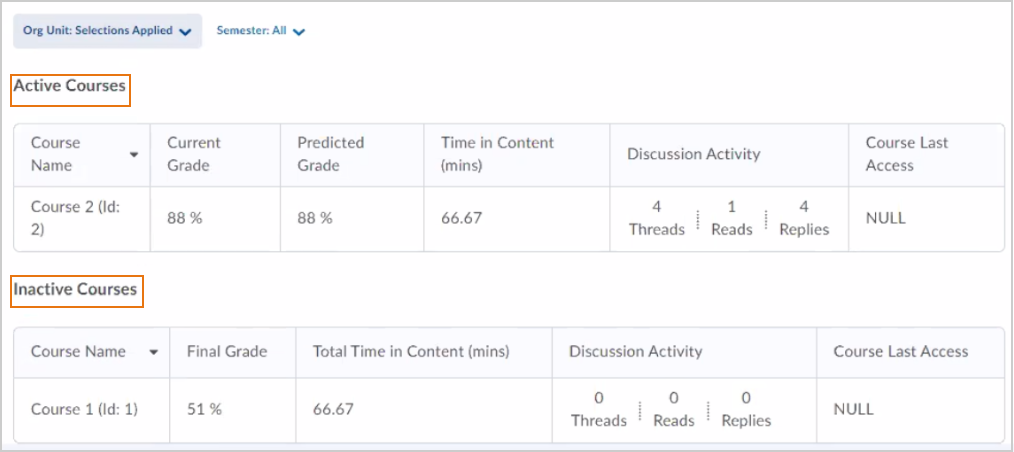
The bottom area contains dynamic tables listing the Active Courses and Inactive Courses that meet the criteria specified by the filters.
As you add filters to the summary data, the visualizations in all the sections automatically change to reflect the updated Summary view.
Using the Summary View
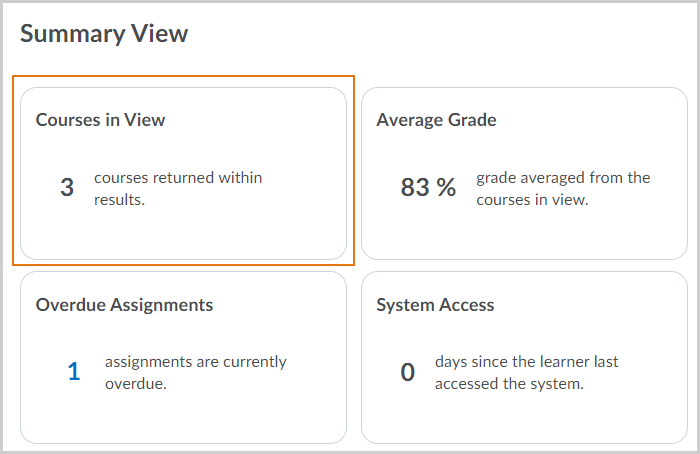
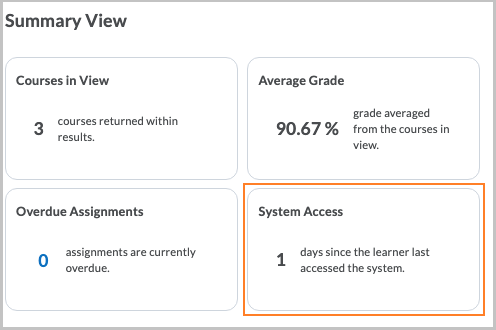
The Courses in View card displays the number of courses (active and inactive) in the summary view based on the filters and permissions applied. If a user interacts with the metrics, this number updates to reflect the courses in the view.
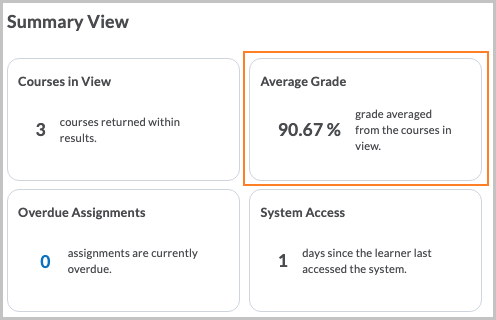
The Average Grade card displays the average current grade or final grade for completed courses for the user across all the courses in the summary view. This number does not include predicted grade values in the average.
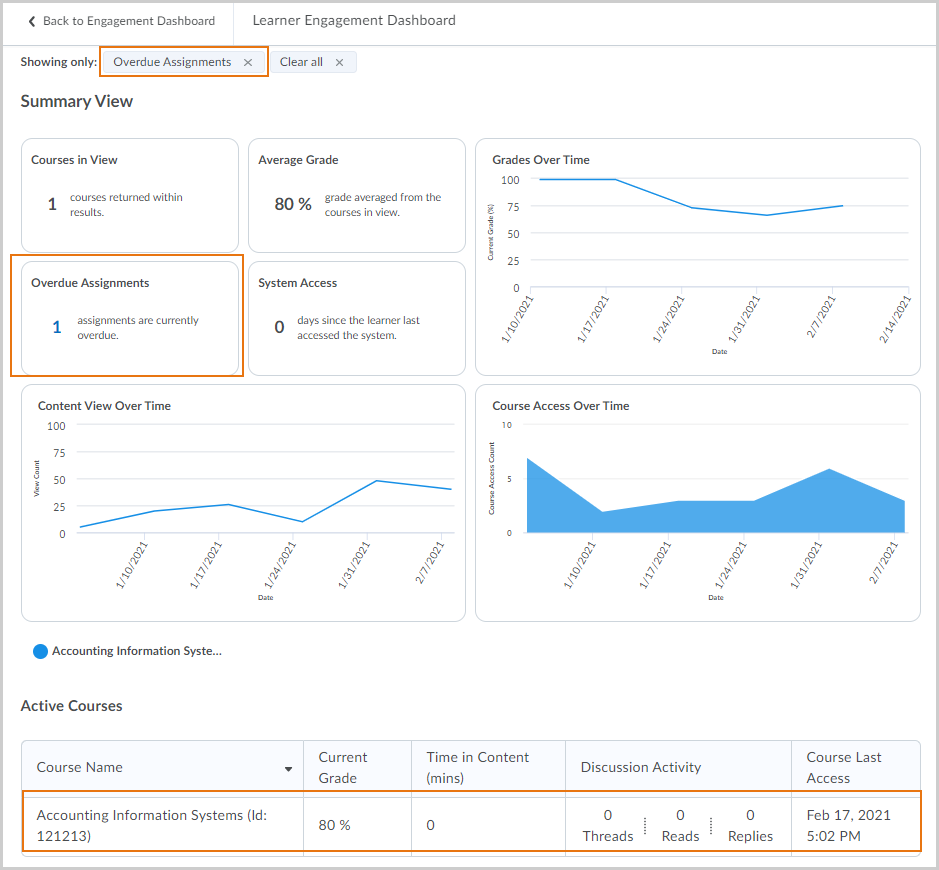
The Overdue Assignment card displays the number of assignments in the courses displayed in the summary view when the due date is past and there is no assignment submission or completion. You can click on the number in the Overdue Assignment card to filter the returned courses to those that have overdue assignments for the selected user.
The System Access card displays the number of days since the user last accessed the system.
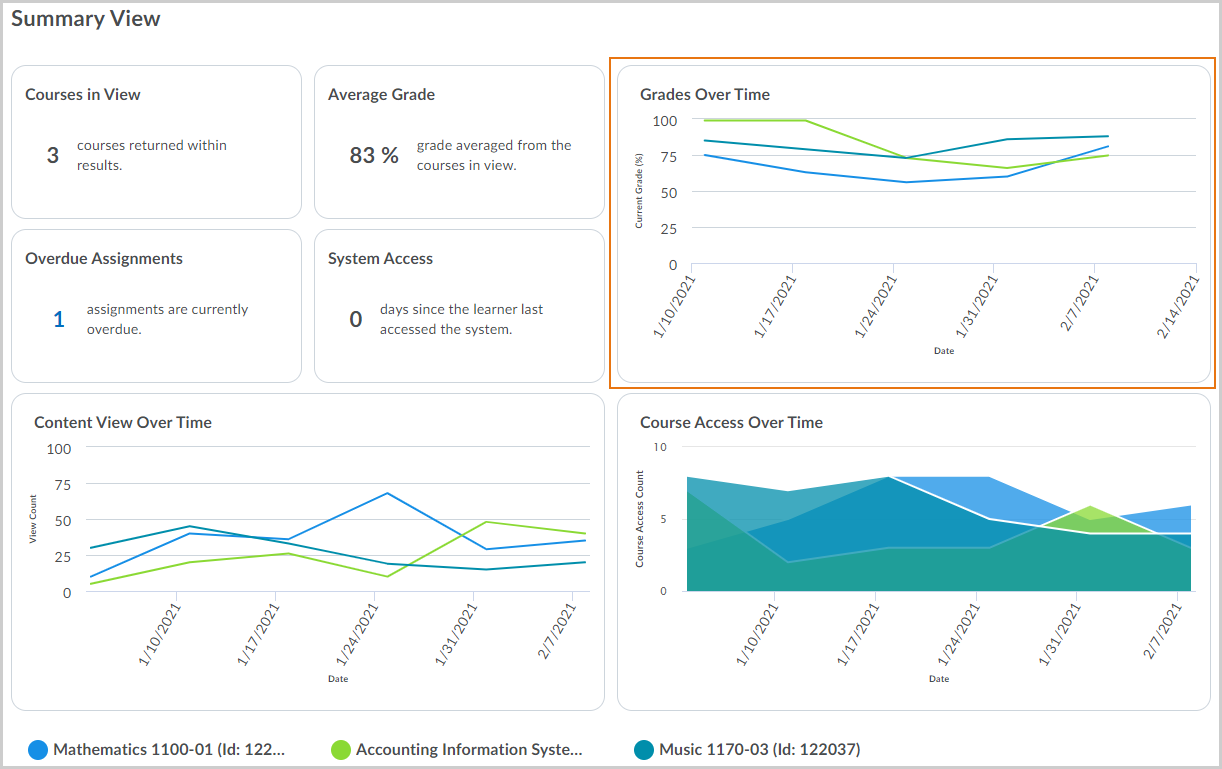
The Grades Over Time trend chart displays the learner's current grade for each week in the selected time frame as a line graph. Each course is represented by a color-coded line, and when you click on a line, the other lines become greyed out. Adjusted and calculated grades are included.
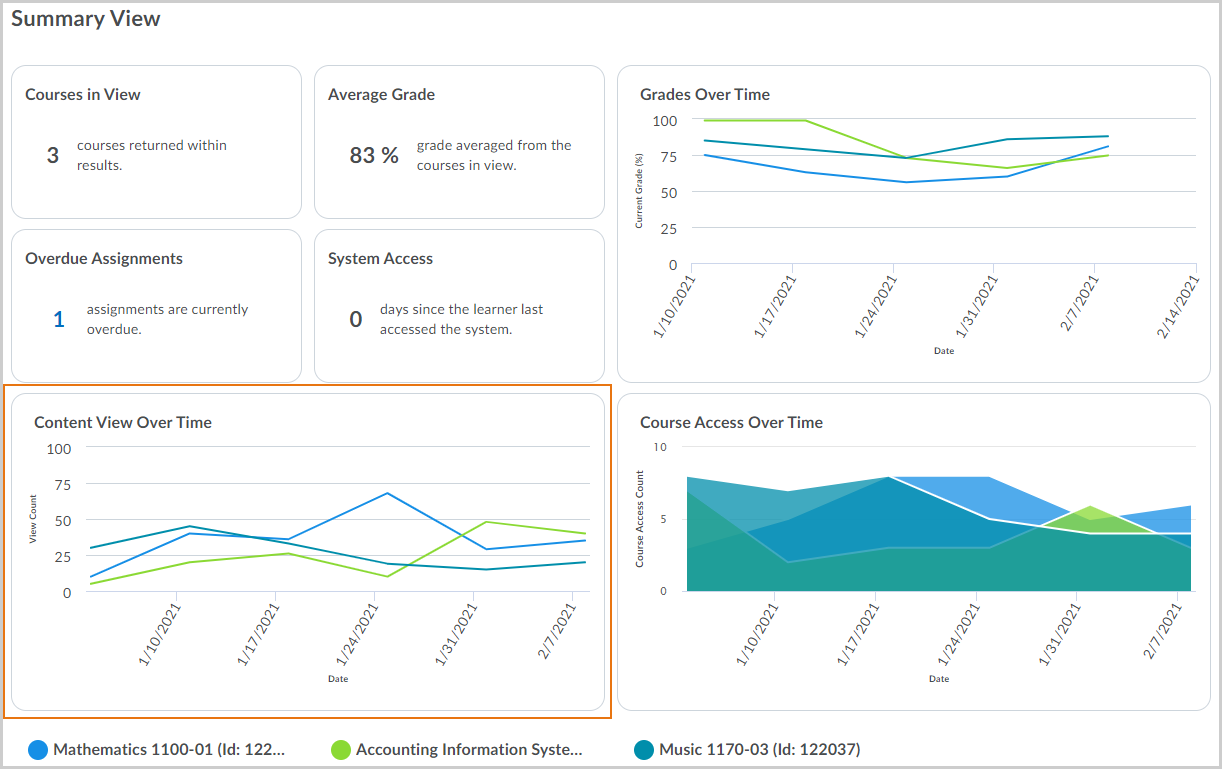
The Content View Over Time trend chart displays the number of content topic views for the learner for each week in the selected time frame as a line graph.
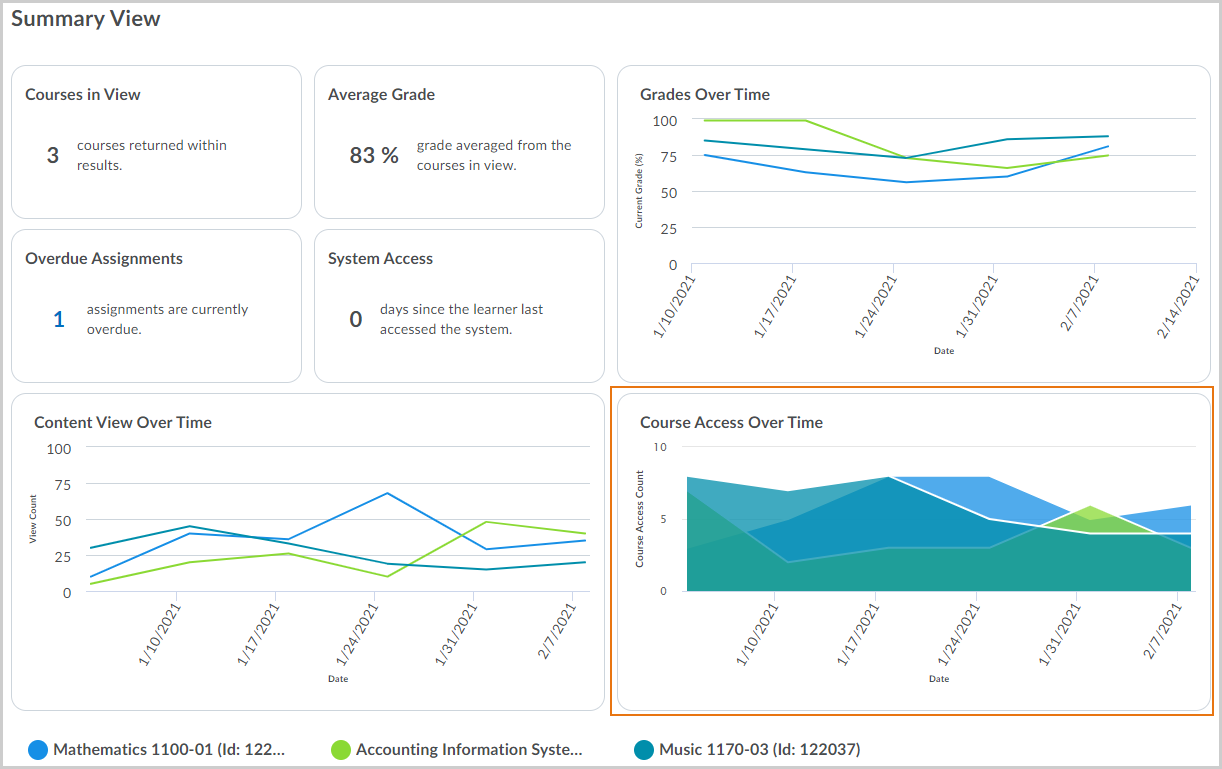
The Course Access Over Time trend chart displays the number of course accesses for the learner for each week in the selected time frame as a stacked area chart.
Using the Active and Inactive Courses view
At the bottom of the page, courses are grouped by active and inactive in this view to make it easier to understand which courses are currently in session. When you return to the overall page, any filters you previously applied are maintained.
An active course is one where:
- The course start date is less than or equal to the current date and the course end date is greater than or equal to the current date.
- The course start date is less than or equal to the current date and the course end date is null.
- The course start date and end dates are both null and the Active flag is selected.
For users of Student Success System, the predicted grade appears on this view for active courses with a model.
Additional information can be found within D2L Brightspace documentation: Using the Learner Engagement Dashboard