The Insights Portal can be found on the navigation bar on your D2L Homepage.

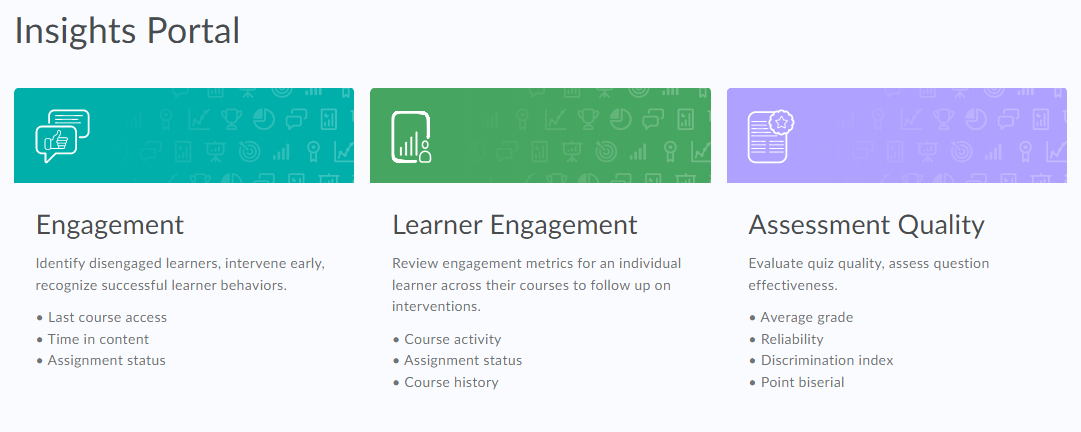
The Insights Dashboard contains reporting for Engagement, Learner Engagement, and Assessment Quality.

Assessment Quality Dashboard - helps educators and instructional designers quickly evaluate the effectiveness of quizzes and quiz questions.
Engagement Dashboard - helps educational advisors identify at-risk and succeeding groups and individuals in order to take appropriate action.
Learner Engagement Dashboard - helps instructors review engagement metrics, such as course activity, assignment status, and course history, for an individual learner across all their courses.
For more information, see the Brightspace Insights Instructor Guide.
Brightspace Insights includes easy-to-use reporting visualizations that provide a complete picture of learners across D2L courses. This allows instructors to track, measure, and monitor learner progress and help improve engagement during their learning journey.
Brightspace Insights includes the following report types:
- Course Access - use this report to better understand user engagement in a course.
- Tool Access - use this report to better understand user engagement with course tools.
- Total Logins - use this report to better understand activity in Brightspace Learning Environment.
Troubleshooting Brightspace Insights reports
Filtering a report by date is designed to report on a specified date range; however, if the last seven days in the date range do not contain data, the report displays data based on the earliest day containing data. For example, if you run a report on June 1, 2019 and the earliest date containing data is May 7, 2019, Brightspace Insights displays data from May 1, 2019 to May 7, 2019.
Additional information can be found within D2L Brightspace documentation: Brightspace Insights