This dashboard provides visualizations to help users understand the quality of assessments using quiz and question statistics such as reliability, average grade, and correlation for all quiz and question types.
To see the Assessment Quality Dashboard, you must be enrolled in the course offerings whose assessments you want to see. Quizzes need at least one attempt to be included in the dashboard.
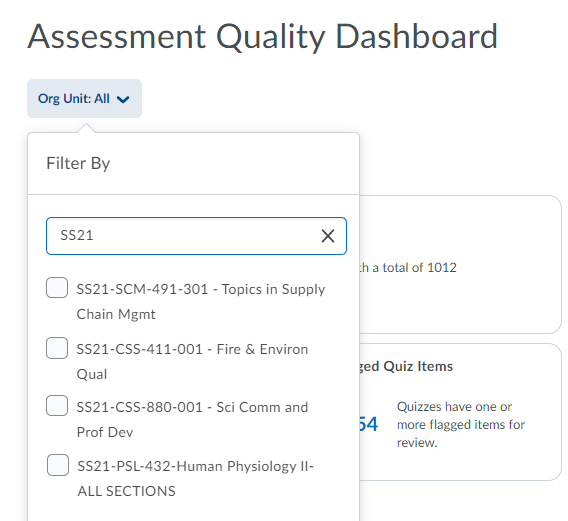
A pop-up appears when you first access the Assessment Quality Dashboard that summarizes what displays in the default view. The Org Unit drop-down filter includes a list of all courses in which a user is enrolled as Course Administrator. It also includes a search bar which can be used to search for a course or semester. You can dynamically add or remove courses by clicking the check box beside the org unit name.
Viewing and interacting with the Assessment Quality Dashboard
The dashboard has three views: the landing page, the Quiz Item Analysis area, and the Preview Question area. The dashboard contains the following functionality:
- Org Unit filtering, which allows filtering of data across different courses.
- Interactive cards and visualizations that enable you to filter through the available data.
- Accessibility features: visual cues like filter tags and toast messages, support for screen readers, and keyboard navigation.
- Pagination, which enables you to define the number of results per view and easily sequence the results.
- The ability to export data as a Comma Separated Value (CSV) file.
- Link to the Quiz Edit page for quick actions.
In general, when using quiz and question statistics, it is important to keep in mind the sample size for the given quiz or question. Metrics increase in statistical relevance as the sample size increases.
The landing page
The landing page shows you visualizations combining the data from all the quizzes you manage. The data on this page enables you to analyze and identify quizzes that are underperforming in terms of grade scores and reliability.
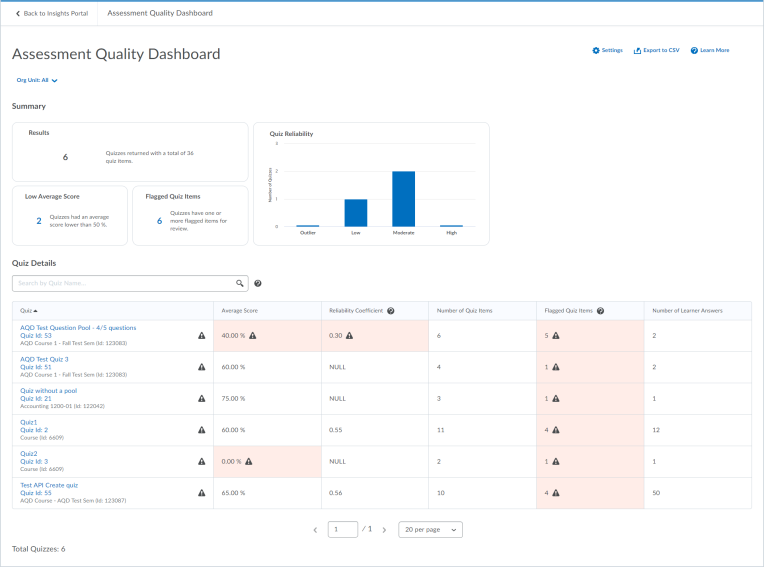
Under Summary, there are cards for Results (the number of quizzes that you manage and meet the criteria applied to the dashboard), Average Score, Flagged Question (the number of quizzes with one or more questions that are outside the set threshold for acceptable values), and Quiz Reliability. You can turn these cards on and off and adjust the thresholds in Settings.
The Quiz Details area contains a dynamic table of quizzes that meet the criteria applied to the dashboard. An "!" icon appears next to quizzes that have one or more flagged questions. Click on any of the quizzes in this table to navigate to the Quiz Item Analysis page for that quiz.
If you want to compare multiple occurrences of the same quiz to see how the statistics vary, enter the name of the quiz in the search input above the quiz table. This applies a filter to the entire dashboard. Quizzes display only if their name matches your search, and courses display only if they contain a quiz whose name matches your search. The search input has truncation limits of 5,000 courses and 50,000 quizzes, so if you have access to a very large number of courses, we advise filtering by course prior to filtering by quiz name for best results.
The Quiz Details table includes the following:
- Quiz- Name of the quiz, truncated to 160 characters, and unique identifier. Also includes the name and ID of the course offering it is a part of.
- Average Score - Calculated as a percentage using the score for each user's first attempt at the quiz.
- Reliability Coefficient - Reliability is calculated for all questions whether the quiz questions are all dichotomous or not. Reliability will usually range from 0 to 1, but negative values are possible.
- Number of Quiz Items - Total number of questions in the quiz.
- Flagged Quiz Items - Number of questions that are outside the set threshold for acceptable values in the quiz.
- Number of Learner Answers - Number of distinct users who have attempted the quiz.
The Quiz Item Analysis area
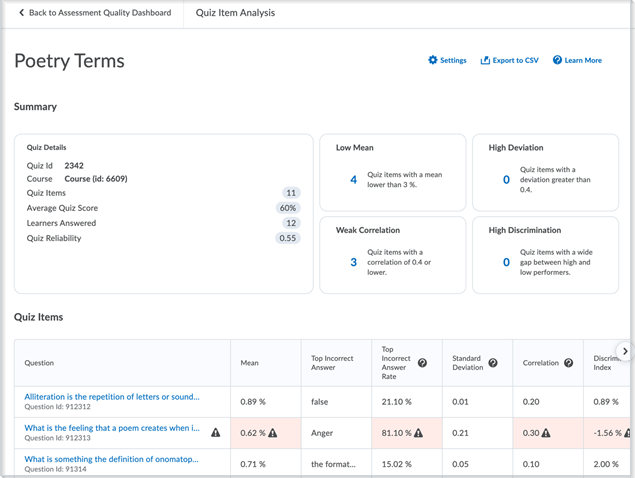
Click on a quiz to navigate to the Quiz Item Analysis area, which provides a breakdown of each question in a quiz.
Click on Go to quiz under the name of the quiz, and the Edit Quiz page opens in a new window.
Under Summary, there are cards for Quiz Details, which includes the details from the previous page; Low Mean, which counts the number of quiz items with a mean lower than your threshold; High Deviation, which counts the number of quiz items with a deviation greater than your threshold; Weak Correlation, which counts the number of quiz items with a correlation lower than your threshold, and High Discrimination, which counts the quiz items with a wide gap between low and high performers. You can turn these cards on and off and alter the thresholds in Settings.
The Quiz Items area contains a dynamic table of quiz items that meet the criteria applied to the dashboard. An "!" icon appears next to quizzes that have one or more statistics out of range of the set threshold. Click on any of the quiz items in this table to navigate to the Preview Question page for that quiz item.
The Quiz Items table displays statistics and details about each question in the quiz, including:
- Question - Question text, truncated to 70 characters, and a unique identifier.
- Mean - Calculated as a percentage to two decimal places using the score for each user's first attempt at the question.
- Top Incorrect Answer - Most frequently reported incorrect answer. Only populated for multiple choice and true or false questions.
- Top Incorrect Answer - Rate Response rate between 0 and 1 for those who selected the most common incorrect answer. Only populated for multiple choice and true or false questions.
- In Question Pool - Indicates if the question is part of a question pool (yes or no).
- Standard Deviation - The standard deviation of the grade of the question using each user's first attempt.
- Correlation - This calculates any possible correlation between the question score and the total quiz score. Displays N/A when all users answer the question correctly.
- Discrimination Index - This calculates any possible discrimination in the question between the higher- and lower-performing learners by subtracting the question's lower 27% from its upper 27%. The higher the difference, the better the question discriminates between high- and low-performing learners. A negative value indicates that more low-performing learners are correctly answering the question than high-performing learners. This would most likely indicate a flawed quiz question.
- Upper 27% - Average question grade of the users with quiz grades in the top 27%.
Note: when there are 10 or fewer question attempts, the upper and lower 50% is considered instead of 27%. This makes the statistic relevant with smaller sample sizes. - Lower 27% - Average question grade of the users with quiz grades in the lowest 27%.
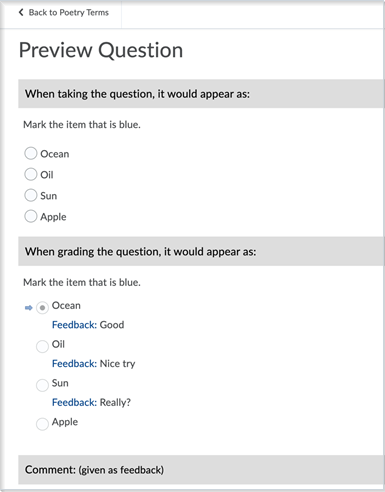
The Preview Question area
Click on a quiz question to navigate to the Preview Question area, where you can preview quiz questions, comments, and hints.
About Rounding
For all of the metrics on the Assessment Quality Dashboard, rounding is performed only once, at the end of the calculation. Different metrics have different numbers of final decimal places. If the digit in the final decimal place is followed by digit greater than or equal to 5, it is rounded up; if followed by a digit smaller than 5, it remains as-is.
For example, 1.2356 rounded to 2 decimal places becomes 1.24, while 1.2345 becomes 1.23.
Additional information can be found within D2L Brightspace documentation: Using the Assessment Quality Dashboard