Achievement Scales
Learning Outcomes are assessed based on the default achievement scale. Most achievements will be assessed by selecting the level under each aligned learning outcome while evaluating the activity. In some cases, there will be suggested achievement levels based on the percentage earned or mapped rubric levels. The suggested level can be manually adjusted based on professional judgment and discretion.
Default Achievement Scale
The current default achievement scale was configured to allow for undergraduate courses to meet outcomes with a minimum of 70%, and a graduate level minimum of 85%. The percentages do not show in the student view and the suggested levels can be overwritten by the instructor while assessing each item.
Important Note: Currently, there is only one default scale used across all D2L courses at MSU. After the May 2023 monthly upgrade, it is possible to have multiple scale options to choose from if added by an MSU D2L administrator. Contact the MSU Service Desk and start a service request if you would like to discuss more options to choose from for your courses or program.
The current default scale uses the following levels for meeting outcomes:
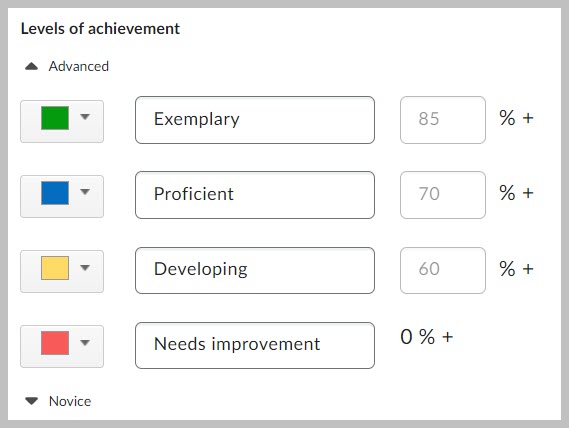
Level Name (percentage used for suggested level)
Exemplary (85%)
Proficient (70%)
Developing (60%)
Needs Improvement (<60%)
Note: The screenshot above is a D2L admin view and is not available from any course views.
How-to assess learning outcomes
Learning outcomes are assessed in the same scoring window as other feedback while evaluating assignments or discussions. Sometimes the system provides suggested levels of achievement for learning outcomes with rubric evaluations or quiz questions.
Mapping the achievement levels to rubric levels
When instructors associate outcomes with a rubric criterion, a level of achievement is automatically suggested based on the rubric levels. Instructors can adjust the levels when creating or editing a rubric that has not already been evaluated by manually mapping the placement of the outcome achievement levels.
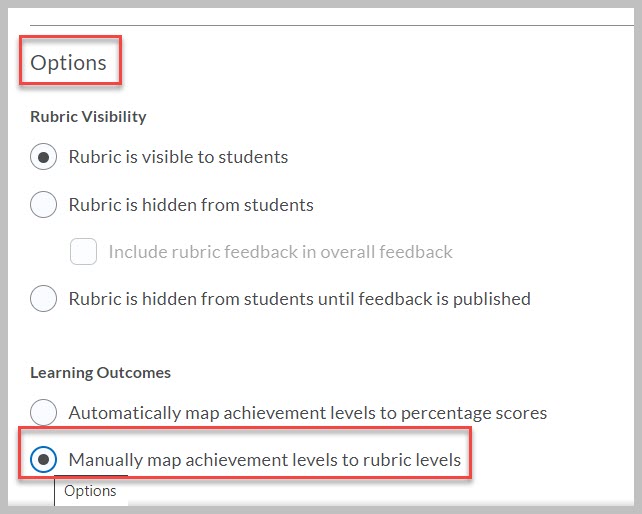
To manually map achievement levels to rubric levels, edit the rubric and open the menu. Select the option to manually map levels or use automatic mapping based on percentage scores.
After selecting the option to manually map levels, move the dots on the rubric levels to align them with the desired outcome achievement levels.
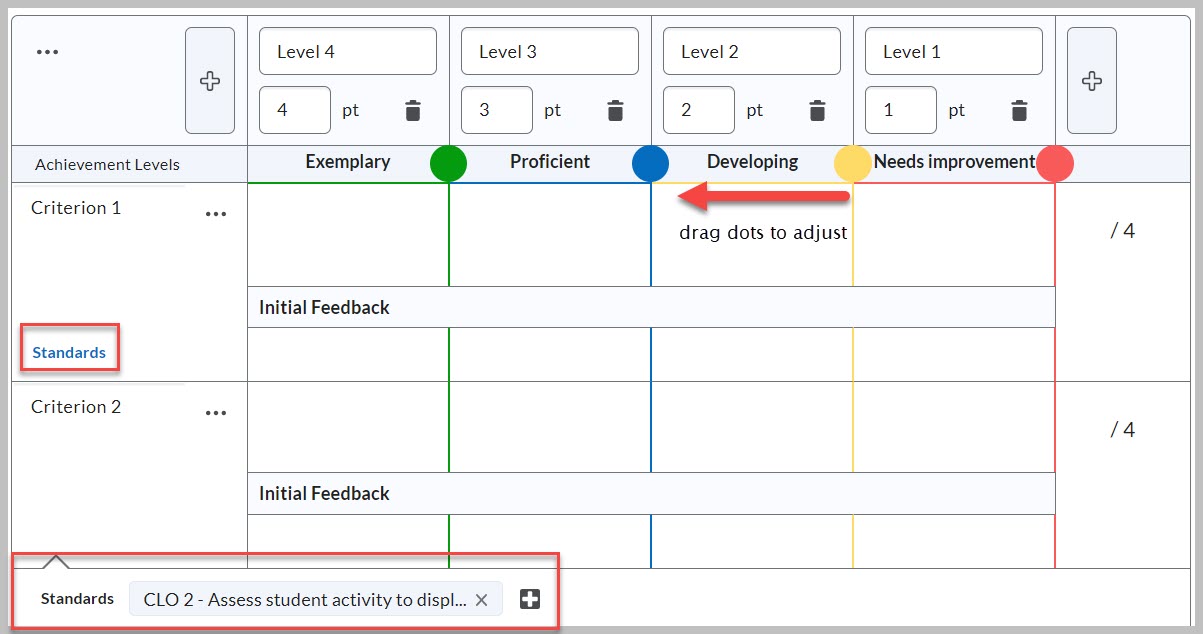
Note: This feature appears only when the scale has percentage values defined and is only enabled for points-based and custom points-based rubrics. For more details, see Mapping outcome levels of achievement to rubric evaluation levels
Evaluating activities with outcomes added to attached rubrics
Suggested levels will be highlighted in the scoring window when assessing individual student assignments and discussions with attached rubrics that contain outcomes.
After you publish your assessments, learners can view results wherever they can view assessed rubrics. This allows learners to understand their progress against learning outcomes and rubric criteria and locate areas for improvement.
Evaluating activities with outcomes added directly
Outcomes added directly to assignments or discussions can be assessed manually by selecting the level of achievement for each learning outcome as you assess each individual learner. The LOs will be displayed under the score and feedback textboxes.
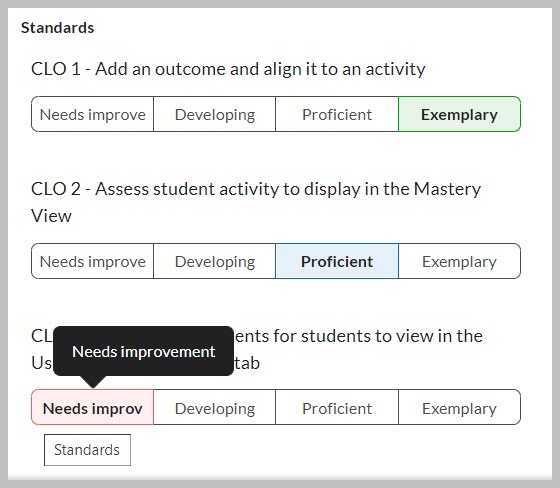
When the achieved levels are published, they will display to the learner as evidence within the Standards tab of their User Progress. Instructors can view each learner's user progress in Class Progress, and also in the Mastery View of learner achievements within the Enter Grades area.
Assessing Assignments or Discussions with a rubric containing standards
As rubrics are evaluated, sometimes a suggested level of achievement will be displayed for each learning outcome that was added to the rubric. Levels will publish at the suggested level unless the instructor manually overrides it.
Assessing Quiz submissions against outcomes
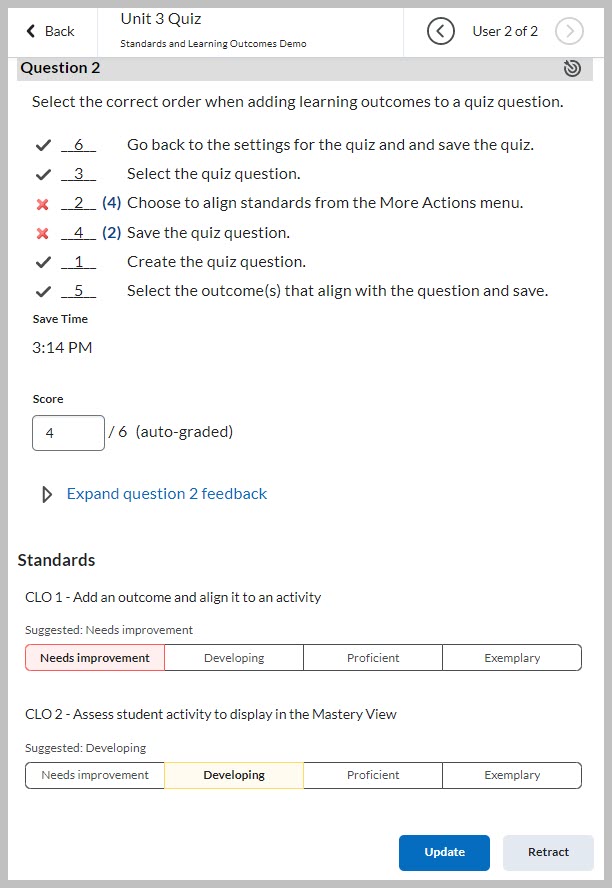
For suggested achievement levels to appear on quiz submissions, the quiz must be configured to allow attempts to auto-publish attempt results immediately upon completion. Instructors can set this option under Evaluation & Feedback in the quiz settings.
View assessments from the Grade Quiz page to see individual responses. Click an attempt to view the quiz details. Scroll below the question response details to view the outcome achievement level suggestions.
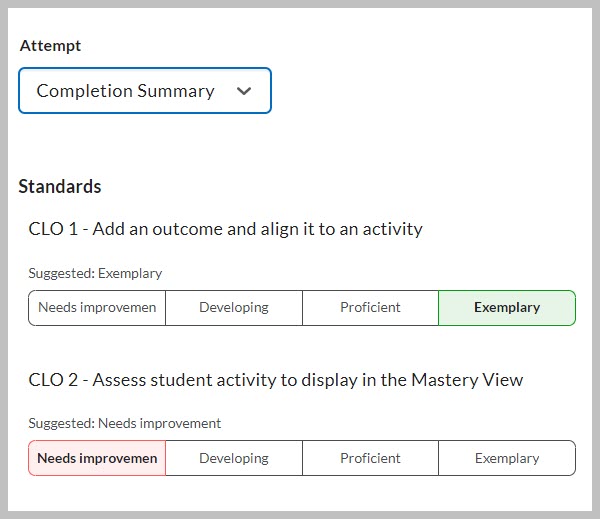
For quizzes with multiple attempts, select the "overall grade" or completion summary below the attempts.
View learner achievement on Learning Outcomes
Class/User Progress > Standards tab
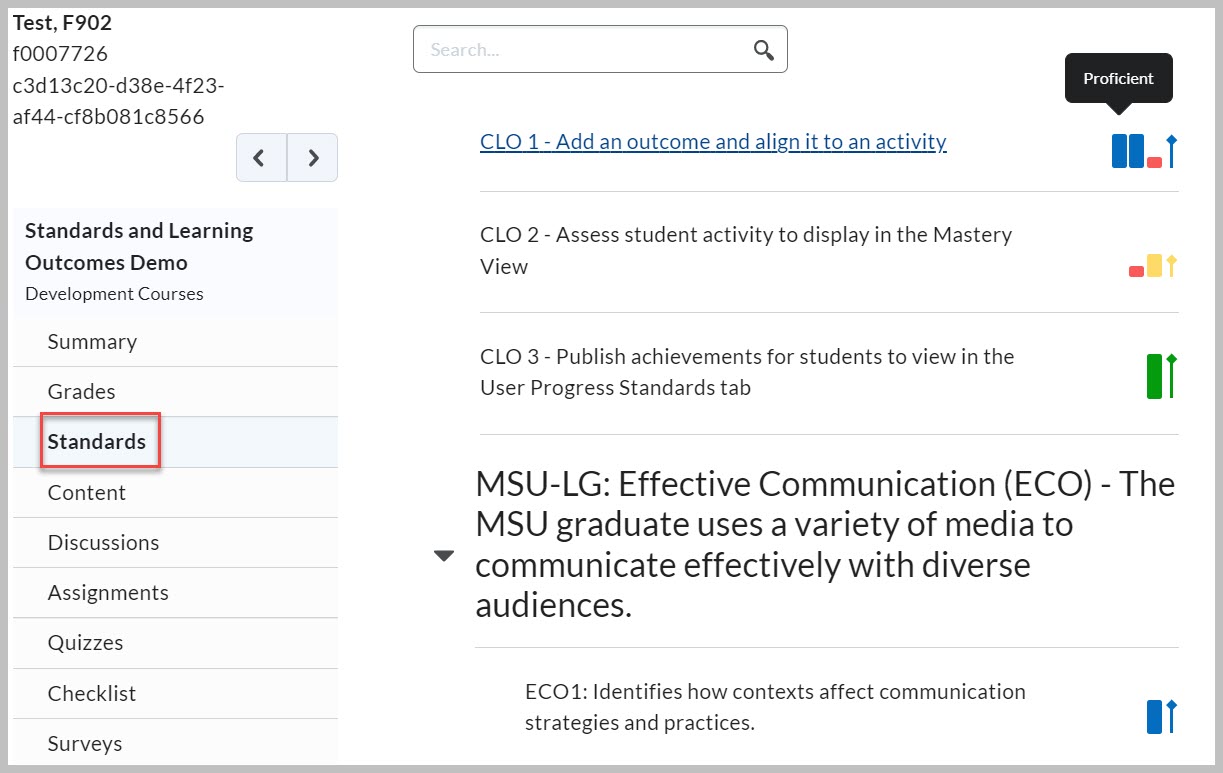
Learners can view details of their achievements by clicking on a specific outcome. They will see an overall level of achievement (arrow) if the instructor has published overall results in the Mastery View.
View learner achievement for multiple quiz attempts
If quiz questions have been aligned to LOs, then the quiz submission appears as a demonstration of that Learning Outcome and is reflected in the visualization on the Standards Progress Page for the learner.
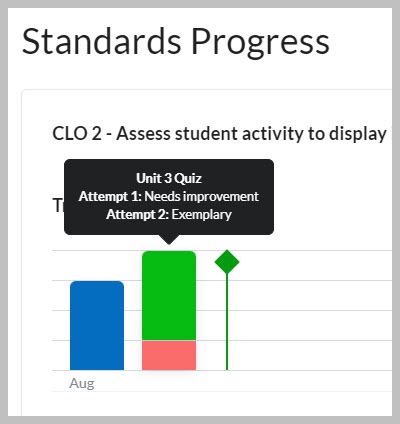
If the quiz permits multiple attempts, each attempt at the quiz is reflected for each LO. On the demonstration details page, each submission attempt is displayed in the evidence timeline scrolling down the page. To launch the details page, click the title of the learning outcome on the Outcomes Progress page.
Each attempt has the achievement sale level designated in the evidence title. If different levels of achievement were obtained in each attempt, then the attempts appear as different colors in the assessment timeline. The colors reflect those defined on the achievement scale.
Mastery View
To enable the Mastery View, you must import or create course-level outcomes within the Standards tool at the course offering level. Then, you need to align the outcomes to rubric criterion rows, assignments, discussion forums, or quiz questions.
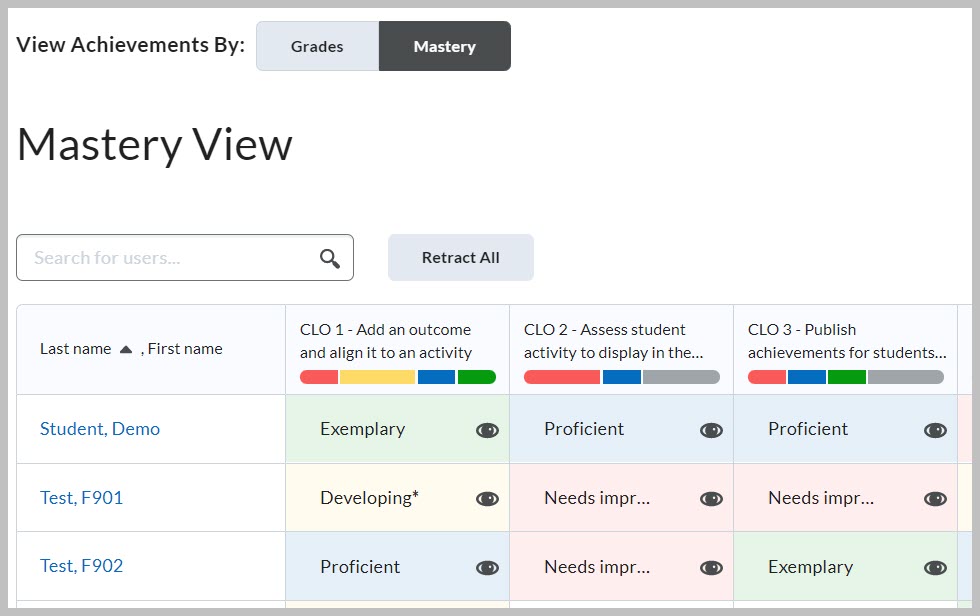
The Mastery View displays evaluated outcomes as the columns of the table and the learners enrolled in the course as the rows of the table. Users can search for specific learners using the search field.
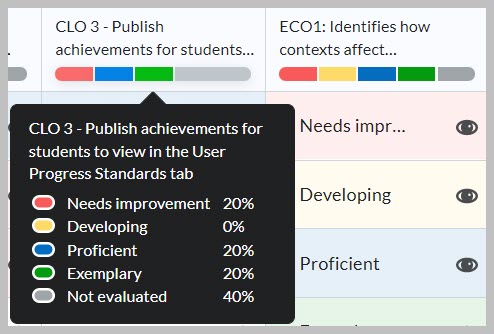
The column header provides the code (notation) of the outcome, if available, and a truncated statement of the outcome description. Below the outcome description in the column header there is a histogram display of learner evaluations related to this outcome grouped by levels of the achievement scale. Hovering over this histogram provides a tooltip with details of the learner evaluations.
The cells in the table view of this page contain information about the evaluation details for each learner. The suggested level of overall achievement displayed in the cell by the level name is determined by the selected calculation method. The color coding of each cell is based on the color assigned to the level of the scale corresponding to the suggested overall level of achievement.
Status Indicators
Within each achievement cell, there are indicators of the status of the learner’s progress toward the achievement, including:
- Overall level of achievement (suggested or manually overridden)
- Manual override indicator in the form of an asterisk
- Published/Not published icons to indicate the visibility status to the learner

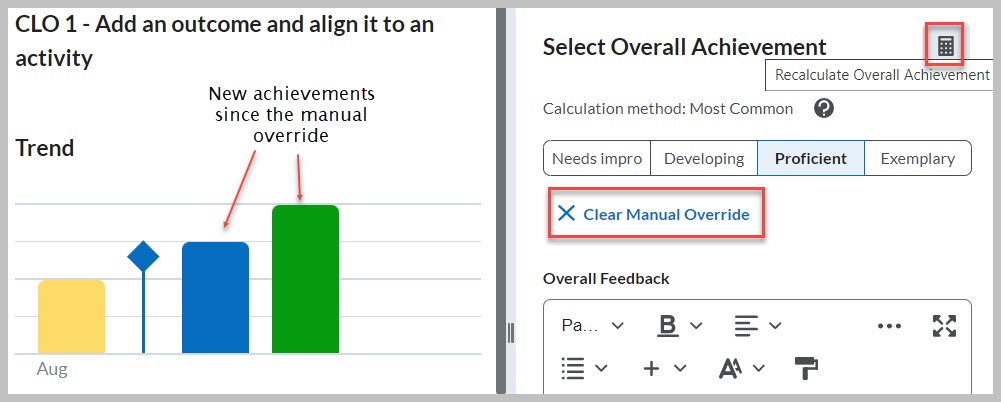
Clicking inside the cell shows the trend graph (with evidence listed below). A calculator icon will show up if newer evaluations have been made since a manual override was recorded.
- The calculator icon indicates that an override may be out-of-date. Clicking on the calculator will update the overall achievement. The instructor can also clear the manual override and resave.
Bulk Publish and Bulk Retract
Use the "Publish All" button to publish the overall achievement evaluations to all learners for all outcomes in one action. Once all the evaluations are published, the button becomes "Retract All," which allows instructors to retract all the published evaluations. You can publish or retract evaluations at any point in the course depending upon when or if the instructor wants to make the overall level of achievement evaluations visible.
Note: Achievement level labels were changed to Mastery, Proficient, and Developing. The screenshots on this page will be updated at a later time.
Other resources and support
Other "Quick View" resources
- Standards: Add and Align Outcomes - Quick View
- Mastery View Settings for Suggested Overall Achievement Level
Support
If you have any questions or need further assistance, please contact the MSU IT Service Desk at (517) 432-6200 or https://ithelp.msu.edu.